Dallas Green Building Clearance IAQ Testing 804.2 Ordinance

Dallas Green Building Clearance IAQ Testing for the 804.2 Ordinance  214.912.4691

Nearly a decade ago, Dallas established an Indoor Air Quality test for new and renovated buildings which pertain to the VOC levels and general indoor air quality in accordance with Ordinance 804.2 for Post Construction & Pre-Occupancy Baseline IAQ Testing.

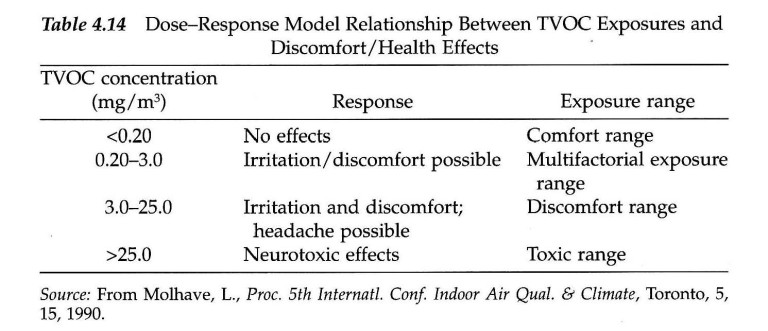
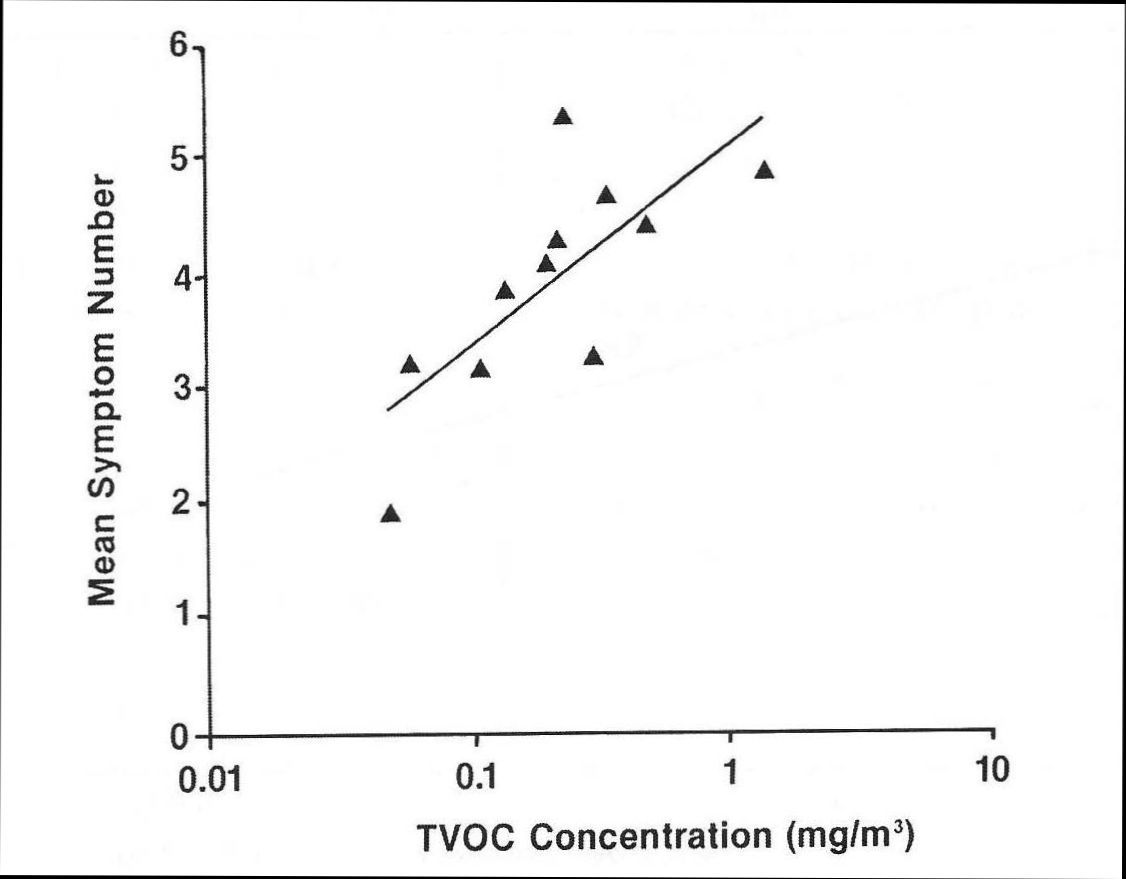
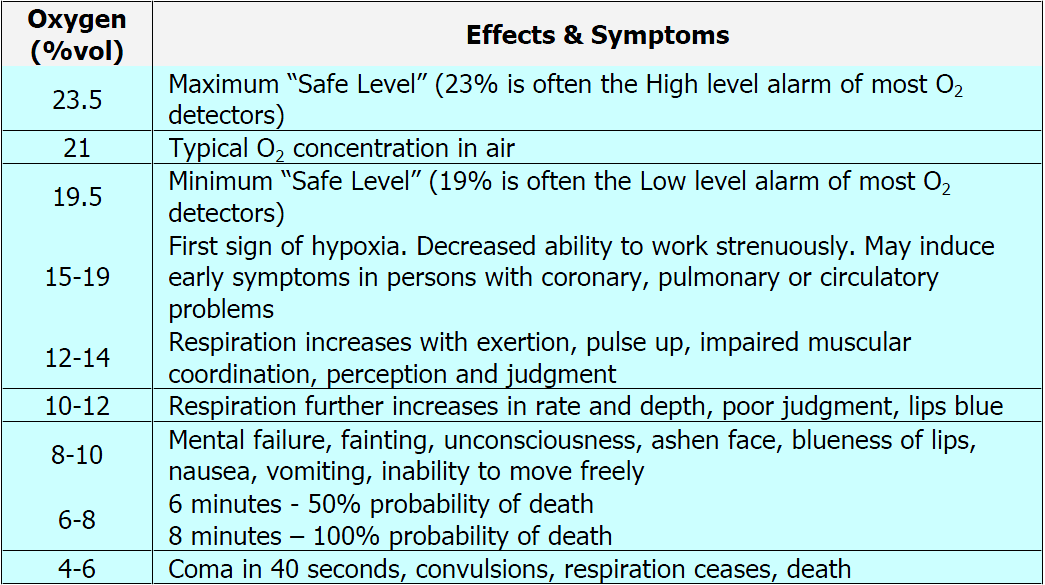
Originally it was much more complicated to perform, but later the ordinance was amended to having VOC (Volatile Organic Compound) levels at less than 500 micrograms per cubic meter ( < 500 ug / m^3) using  ASTM D5197, ASTM D5466, ASTM D6196, ASTM D 6345, or ISO 7708 standards.

Dallas Green Building IAQ Indoor Air Quality Clearance Testing Post-Construction for 804.2 Certificate of Occupancy

NEED A DALLAS GREEN BUILDING CLEARANCE AIR TEST QUOTE?

214.912.4691

Please provide the following information:

  • Physical address of the site including Suite # if applicable
  • Square footage and number of floors
  • Nature of the facility (office building, restaurant, etc.) and the Name so it can be more easily located upon arrival
  • How soon you need the survey
  • How far along the construction is as far as the punch list is concerned. This is IMPORTANT because if you only have half the electrical working, no HVAC, the place is swarming with subcontractors then performing the test may be impossible
  • Who will be onsite as certain kinds of work (sanding, drilling, etc. ) can either interfere with the results or impede the ability to assess the indoor air quality. It would be unfortunate to be charged twice because some of the above was overlooked. See below for more tips.
Dallas Green Building Clearance Post-Construction IAQ Testing 804.2 Indoor Air Quality

Dallas Green Building Clearance Post-Construction IAQ Testing 804.2

TIPS TO PASSING THE DALLAS GREEN BUILDING INDOOR AIR QUALITY CLEARANCE TESTING 804.2:

  • Use low-VOC paints and in cases where you have to use oil based paints and stains, try to do those earlier in the construction phase so that they have more time to outgas.
  • When it is warmer outside, run the HVAC system to help flush the air (particularly if you are able to dilute it with makeup air)  and / or keep at least two doors that are diagonal from each other in the facility to create a cross draft through the building. Depending on what phase of construction you are in, how easy it is to access the building, the local neighborhood, etc. it is good to balance this with necessary physical security measures to protect your workers and the property.
  • When it is cooler outside, running the HVAC on heat can help as well. In general, outgassing happens faster the WARMER and DRIER the air.
  • In rooms that have heavier use of epoxy paints, stains on wood, oil base on trim or other strong odorous solvents, keep the doors open when possible to assist in flushing out the room.
  • Time the survey so that you have the best chance of passing. If it has been a few weeks or more since the finish out, the chances are very good.


We work with the following list of Dallas Green Third Party Building Providers: (latest update April 2020)

Dallas Green Building Clearance City Hall List of Green Third Party Providers June 2021

Dallas Green Building Clearance List of Third Party Green Providers

https://indoorairqualitytestingdallas.com/tag/dallas-green-building-clearance/


Originally it was much more complicated to perform as shown in the above chart, but later the ordinance was amended to having TVOC (Total Volatile Organic Compound) levels at less than 500 micrograms per cubic meter. ( < 500 ug / m^3)

https://dallascityhall.com/departments/sustainabledevelopment/DCH%20documents/2015_icc/2015_IGCC_Amendments_FINAL.pdf


International Green Construction Code 804.2 with Specific Indoor Air Quality and Pollutant Control Measures (note that in Table 804.2 only TVOC is used for Dallas compliance)

Dallas Green Ordinance Clearance IAQ Guidelines 804.2 NEW IGCC 2012 PDF Format

https://codes.iccsafe.org/content/IgCC2015/chapter-8-indoor-environmental-quality-and-comfort

https://indoorairqualitytestingdallas.com/tag/dallas-green-building-clearance/

AISD Indoor Air Quality Requirements PDF Format

NWISD IAQ DIV 23 Specs PDF Format

Huckabee SECTION 01 5719 – INDOOR AIR QUALITY CONTROLS PDF Format

WHO OR WHAT COMPANY DOES INDOOR AIR QUALITY TESTING NEAR ME?

ScanTech Technical Consulting provides certified indoor air quality testing for commercial clients in the Dallas – Fort Worth Texas area detect and measure harmful contaminants.  Call 214.912.4691

WHO OR WHAT COMPANY DOES DALLAS GREEN BUILDING INDOOR AIR QUALITY CLEARANCE TESTING NEAR ME?

ScanTech Technical Consulting provides certified indoor air quality testing in the Dallas Texas area for commercial clients to help pass the Dallas Green Building Clearance Code 804.2 for a Certificate of Occupancy.  Call 214.912.4691

LARGER COMMERCIAL PROJECT SERVICE RANGE – NATIONAL & INTERNATIONAL

Alabama | Alaska | Arizona | Arkansas | California | Colorado | Connecticut | Delaware | Florida | Georgia | Hawaii | Idaho | Illinois | Indiana | Iowa | Kansas | Kentucky | Louisiana | Maine | Maryland | Massachusetts | Michigan | Minnesota | Mississippi | Missouri | Montana | Nebraska | Nevada | New Hampshire | New Jersey | New Mexico | New York | North Carolina | North Dakota | Ohio | Oklahoma | Oregon | Pennsylvania | Rhode Island | South Carolina | South Dakota | Tennessee | Texas | Utah | Vermont | Virginia | Washington | West Virginia | Wisconsin | Wyoming | Washington D.C. (District of Columbia)

Countries include the United States, Canada, Australia, New Zealand the United Kingdom (England, Scotland, Wales, Ireland) and Western Europe.

*LEGAL NOTICE*

All information on this website either written or implied is the express opinion of ScanTech Technical Consulting. ScanTech Technical Consulting and it’s owners are not responsible or liable for any damages arising from the misuse, misinterpretation or other consequences of the content of this website either in part or in whole. This includes all external weblinks, PDF documents, photos or other references (informational or otherwise) to 3rd parties including government agencies, health organizations, etc.

15770 Dallas Parkway Suite 900 Dallas, TX 75248  (Not Accepting Visitors due to C19)

Phone: (214).912.4691      http://www.emfsurvey.com

ScanTech Technical Consulting: Professional Electromagnetic EMF Biomedical Implant & Equipment Indoor Air Quality Testing & Environmental Inspections

COPYRIGHT 2002 – 2022

Dallas Indoor Air Quality Testing 214.912.4691 – Dallas Green Building Clearance Testing 804.2, Dust & Particulate Matter, Bacterial / Mold Inspection and SARS-CoV-2 Air Testing

DAYS / HOURS OF OPERATION  (text to with inquiries – 24 / 7 but please include physical address, square footage and email)

214.912.4691

7 Days a Week Mon – Fri: 8 AM – 8 PM                   Weekends: Noon – 6 PM

COMMERCIAL / INDUSTRIAL CLIENTS ONLY –  HOMEOWNERS & RESIDENTIAL CLIENTS CLICK HERE

City of Dallas Green Building Clearance Post Construction IAQ (Indoor Air Quality) Testing  (804.2)

Dallas Green Building Post-Construction IAQ Clearance Testing for 804.2 Certificate of Occupancy

Biomedical / Environmental Health & Safety Consulting & Field Testing With Industrial Hygiene & Microbiology expertise including Bacterial Contamination Testing

Novel Coronavirus SARS-CoV-2 / CoViD-19 Commercial / Industrial BioSafety Air & Surface Swab Testing & Consulting for Pandemic Response & Best Hygiene Practices

Based on our expertise in microbiology, disinfectant chemistry, respirators, indoor air quality testing as well as Industrial Safety, Health & Hygiene work.

Indoor Air Quality Dallas Houston Austin

P100 Respirator with 2091 Filters by 3M

214.912.4691 – Through years of performing environmental testing in the Dallas / Fort Worth – DFW Metroplex area, ScanTech has evaluated numerous risk factors that impact human health from the perspectives of both short term (acute effects) and long term (chronic health issues) impacts in the occupational health realm.

* ScanTech only performs IAQ inspections for COMMERCIAL / INDUSTRIAL CLIENTS

ScanTech can check for the following key indoor air quality level indicators (many with time-based datalogging available) and have a report for you at the time of the onsite visit:

  • Formaldehyde (HCHO)
  • VOCs (Volatile Organic Compounds)
  • Carbon Dioxide (CO2) – measurement of fresh air dilution that tracks with VOCs
  • Carbon Monoxide (CO) – a dangerous from combustion byproducts
  • Respirable Dust Particles in PM2.5 (fine) and PM10 (coarse) size regimes
  • Oxygen Levels
  • HEPA Filtration and other central air purifier efficiency (MERV Rating)
  • Pressure differentials between inside and outside (affects contamination potential)
  • Relative ventilation levels – critical to know in newer buildings that are tightly built

Specialized Optional Air Testing

  • City of Dallas Green Building Post Construction IAQ Clearance Testing 804.2  https://emfsurvey.com/dallas-green-iaq-clearance-testing-post-construction-804-2-certificate-of-occupancy/
  • Surface Swab & Air Testing for Novel Coronavirus SARS-CoV-2 which causes CoViD-19
  • Mold Testing & Inspection including air samples, tape lifts and visual inspection
  • Bacterial ATP, Microorganism, Parasite & Bio-Film issues including Legionella
  • Radon Rn-222 Levels (alpha emitter lung carcinogen found in Texas including Dallas)
  • Ozone levels testing – ozone is a oxidizing respiratory irritant
  • Hydrogen Sulfide (H2S) – toxic sewer gas that has a foul odor

along with atmospheric factors such as:

  • Temperature
  • Relative Humidity
  • Absolute Humidity
  • Mixing Ratio, Vapor Pressure, Dew Point
  • Barometric Pressure (to judge whether the structure is under positive or negative pressure with respect to the outside air)
National Ambient Outdoor Air Quality Standards

National Ambient Outdoor Air Quality Standards set by the EPA (Environmental Protection Agency)

Many residents of the Dallas / Fort Worth area suffer from the following symptoms, ailments, and diseases – much of which can be traced either directly to air quality and composition or is exacerbated by poor air quality:

  • Allergies & Sinus Infections – (high particulate counts and VOCs, formaldehyde)
  • Chronic Allergic Rhinitis – (bio-aerosols)
  • Eye irritation – (formaldehyde, hydrogen sulfide, VOCs)
  • Congestion – (high particulate counts and VOCs, formaldehyde)
  • Inflammation – (formaldehyde, VOCs)
  • Fatigue – (carbon monoxide, carbon dioxide)
  • Insomnia
  • Headaches – (carbon monoxide)
  • Dizziness – (carbon monoxide)
  • Cognitive issues including difficulty focusing
  • Nausea
  • Coughing – (high particulate counts, mold, MVOCs)
  • Asthma & other breathing difficulties – (MVOCs, high particulate counts, ozone)
  • Bronchitis – (irritation of the lung bronchi)

These issues can contribute to and/or be symptomatic of more serious ailments such as:

  • COPD (Chronic Obstructive Pulmonary Disease)
  • Hypersensitivity Pneumonitis
  • Carbon Monoxide / Carbon Dioxide Poisoning
  • Autoimmune Disease
  • Cardiovascular Disease
  • Stroke
  • Lung Cancer
  • Leukemia
  • Non-Hodgkin’s Lymphoma
  • Neurological issues due to chemical exposure and/or oxygen deprivation

In many cases, a simple series of air quality tests that detect and report important metrics such as respirable particle levels, VOCs, formaldehyde levels, radon gas, carbon monoxide, carbon dioxide, oxygen levels, etc. can narrow down the issue(s) responsible. Very often, mitigation is relatively inexpensive and well worth the modest investment.

While ScanTech can make suggestions on how to clean up your air, we are not an equipment vendor or installer, so there is no conflict of interest in selling you products that you don’t need. (or that may make things worse)

ScanTech Residential Service Map Dallas Fort Worth DFW

  • Nanotoxicology testing for evaluating the safety of nanomaterials which being incorporated in many modern manufactured products. We will collect and send samples to labs that are able to analyze important characteristics such as particle size, charge, solubility, geometry, aspect ratio, etc. in order to determine potential biological impact. The environmental effect of many nanoparticles are largely unknown and currently subjects of scientific research.

Cities for commercial indoor air quality (IAQ) inspection services include: Dallas, Fort Worth, Houston, Austin, San Antonio, Plano, Highland Park, University Park, Park Cities, Arlington, Grapevine, Frisco, Denton, McKinney, Allen, Lewisville, Irving, Mesquite, Bedford, Euless, Richardson, Coppell, Grand Prairie, Garland, Addison, Farmers Branch, Rockwall, Carrollton, Parker, Rowlett, Lucas, Fairview, Park Cities, Keller, Roanoke, The Colony, Highland Village, Lake Dallas, Corinth, Prosper, Duncanville, Lancaster, Rowlett, Royse City, Trophy Club, Southlake and Hurst. Counties served include Dallas, Collin, Denton, Tarrant and Rockwall County.

Air Quality TVOC (Total Volatile Organic Compound Theory) and Health Effects

It is a widely held belief in the environmental health sciences community that exposures to individual VOCs and SVOCs (Semi-Volatile Organic Compunds) in indoor environments ARE NOT the sole factor for health issues and symptoms so much as the COMBINATION of the chemicals in question. This is the basis for what indoor air quality scientists call “TVOC Theory”.

While exposures to VOCs tend to be at levels significantly lower (by two or more orders of magnitude) than safety precautions (PELs and TLVs) outlined by health advisory bodies such as the ACGIH and OSHA, it is believed that there is a synergistic (additive and multiplicative) effect caused by the combined chemical loading of the hundreds of different organic chemicals which may result in symptomology and even a condition known as Sick Building Syndrome. (SBS) This is what would be called in engineering parlance, a parametric (multiple factor) failure with no single chemical being solely responsible for illness.

TVOC Table for Environmental Illness Effects from Indoor Air Quality IAQ Problems

Dose Response Model Relationship between TVOC levels and Health Effects  (Toluene Equivalent) with 5 mg/m^3 and 25 mg/m^3 approximately equivalent to 1 ppmv and 5 ppmv toluene equivalent. Effect threshold for acute effects with exposure to sub-mixtures of 6-9 VOCs are less than 1.7 mg/m^3.

The biological mechanism for this phenomena is linked to the stimulation of the trigeminal nerve system which is also known as the “common chemical sense”. This system is one of two olfactory (smell) mechanisms by which humans respond to odor. The chemical sense organ consists of trigeminal nerves in the nasal cavity and eyes as well as the facial skin areas. Stimulation of these nerves produces irritation which includes burning, stinging and smarting. Other effects include changes in heart and respiratory rates, as well as coughing, sneezing and tearing up of the eyes.

TVOC theory is more an indicator of the risk of nonspecific sensory irritation to relatively unreactive VOCs as opposed to a generic indicator of the potential health risks of contaminated indoor air quality.

Total VOC Volatile Organic Compound Chart for Indoor Air Quality

TVOC Dose Symptom Relationship Log Chart

A log-linear relationship between symptom prevalence rates and concentrations of terpenes, n-alkanes (C8-C11) and butanols in problem buildings. ScanTech checks for TVOCs in the Dallas, Fort Worth, Houston and Austin metropolitan areas.

More information can be found in this European report:

TVOC Indoor Air Quality Investigations

Biological Contaminants in Indoor Air Quality: Allergens, Bacteria, Mites, Viruses

Bioaerosol Organic Dust from Mold Bacteria Pollen in Indoor Air Quality

Organic Dust in Indoor Air Quality

There is growing evidence that a large proportion of environmentally related or contributed illness is correlated with particulate phase (solid) and (to a lesser extent) gas phase exposures to contaminants produced by biological organisms such as mold, bacteria, dust mites, etc. And it is not just live organisms which are at issue, but even the RESIDUAL BIOLOGICAL MATERIAL of dead or non-viable fungus, molds, viruses, bacterial species and pets which can trigger symptoms and contribute or cause certain diseases.

VOCs Particulates Dust Bioaerosols Chart Indoor Air Quality

Indoor Air Quality Contaminant Composition by %  – VOCs Particulates Bioaerosols Chart

These contaminants from both live and dead biological organisms include antigens, endotoxins, glucans, mycotoxins, microbial volatile organic compounds, (MVOCs) and immunologically active particles produced by insects, arachnids, (mites / spiders) and common pets such as cats and dogs.

These contaminants are known as “bioaerosols” or “organic dust” and vary in size from less than 1 micron to over 100 microns in diameter. Note that the smaller the particle, the more likely it is to remain suspended in the air (for days or longer) and penetrate the epithelial cells of the respiratory tract to enter the bloodstream directly.

Bioaerosol Size Ranges in Indoor Air Quality

Bioaerosol Size Ranges in Indoor Air Quality Organic Particles & Contaminants

Live species of microbiological origin may cause infectious disease by airborne transmission which again stresses the importance of indoor air quality. With a heavy enough load, infection through contact and / or ingestion of heavily contaminated surfaces (not necessarily inhaled) could result. Exposures to mold spores / fragments and allergens produced by insects, pet danders may cause immunological reactions such as chronic allergic rhinitis and asthma which has a high prevalence rate in developed countries and resembles symptoms of gas phase irritants. Exposures to HIGH concentrations of small fungal spores and the spores of higher bacteria may cause hypersensitivity pneumonitis.

Exposures to fungal glycans, bacterial endotoxins (such as found in Gram negative bacteria) or MVOCs may also cause inflammatory responses in the respiratory system. Mycotoxin exposure may directly poison the human organ systems.

Bacteria: Different Size Shape Arrangement of Bacterial Cells

Bacteria: Different Size Shape Arrangement of Bacterial Cells

Different Size, Shape and Arrangement of Bacterial Cells


Indoor Air Quality Testing of Fine (PM2.5) and UltraFine Particles – Why Smaller Particles = Unsafe and Hazardous

It isn’t necessarily the dust you can see that can cause the most severe health issues, it is microscopic dust that is smaller than the eye can resolve that is now linked to a number of ailments of not just the respiratory tract, but also cardiovascular disease.

Why is this?

Because larger particles such as PM10 or 10 micron particles which fall into the COARSE size range dust particles (2.5 microns – 10 microns) as defined by the EPA:

  • Fall to the ground much faster (within minutes) instead of staying airborne for days or longer where they can be inhaled such as is typical of smaller particles. This also means that smaller particles can travel much further from the source. (such as combustion products from a road or highway)
  • The bodily defense mechanisms of mucus and cilia which are designed to trap larger particles and move them up and out of the lungs do not defend as well against smaller particles as they can bypass these systems and make their way progressively further down into the respiratory system.

However, the smaller PM2.5 particles which fall into the FINE size range (0.5 – 2.5 microns) are:

  • Sufficiently small particles of a few microns or less in diameter which can actually bypass the para-cellular (between the cells) junctions of the epithelial cells in the lung air sacs, which means they can go deep enough into the human respiratory system to pass DIRECTLY into the bloodstream.
  • Prone to stay suspended for much longer periods of time (hours, days, weeks) and can travel a longer distance from the original source.
  • Not easily filtered out by the body’s natural defenses due to their small size.
  • And if these particles are of a chemical nature, (such as aggregated / adsorbed VOCs, heavy metals, etc.)  then toxic damage can occur. If they are of a more inert nature, they can still cause damage by nucleating deposits in arteries.

For an idea of how small these particles are in relation to familiar objects such as hair and sand, here is an illustration.

PM2.5 Particle Scale from Mold Dust Pollen and Indoor Air Quality IAQ

PM2.5 Particle Scale and Effects Indoor Air Quality – microns are abbreviated as um or micrometers

Some of the worst air quality readings I get are inside of expensive homes that look immaculate, (because the larger, visible dust particles have been cleaned up) but still do not adequately filter out the more dangerous smaller suspended respirable particles. (SRP)

UltraFine particles (UFP) are in the nanoscale range of 100 nanometers or less (0.1 microns) just below the PM2.5 FINE particle size range and they can penetrate though the membranes of cells and migrate to distant organs such as the brain. An example is Diesel Particulate Matter (DPM) which are essentially soot (carbon) but with carcinogens such as benzopyrenes adsorbed onto the particle which makes it a potential physio-chemical toxin. Benzopyrenes are considered harmful because they can intercalate (insert themselves) in between the nitrogeneous bases of DNA and thereby interfere with self-replication and protein production by transcription errors.

VOCs Indoor Air Quality Harmful Toxic Airborne Chemical - Structural Diagram

Chemical Structural Diagram of Benzo(e)pyrene (a VOC)

Ambient Air Pollution and Risk for Ischemic Stroke and Transient Ischemic Attack (TIA)

New Buildings and Carbon Dioxide Levels: The Overlooked Indoor Air Quality Health Hazard

One of the “mythologies” that I have heard from clients and real estate agents is something along the lines of “But the house is too new to have any air quality issues, isn’t it?” Actually, it is usually the opposite. Besides the fallacy that newer is necessarily better (how long do appliances last now compared to 30 years ago?) there are several reasons why air quality in a new home may be severely impaired compared to an older one.

  • The construction materials and potentially new furniture, carpet, linens, etc. are still outgassing (releasing chemical fumes) for weeks and months after the initial build.
  • All of the dust from construction has not necessarily been removed from the general air circulation with the finer, more dangerous fine and ultra-fine particulate matter known to stay suspended for weeks.
  • Unpacking of boxes and materials from the move can release contaminants that have now been imported into your home.
  • Houses in general are built more “tightly” than in the past with the aim of increased energy efficiency. As with any engineering design, there is almost always a trade-off or a compromise somewhere. In this case, you potentially cut down on the amount of fresh air and oxygen in exchange for saving money on your utility bill. This means increased CO2 (carbon dioxide levels) which is potentially hazardous to your health. Please note that I am not talking about carbon monoxide which is an entirely different gas.
  • There tends to be a synergistic relationship between CO2 levels and VOC (Volatile Organic Chemical) levels in a structure. Elevated carbon dioxide levels means that ventilation is inadequate, not just for human occupants but ALSO for proper outgassing of the chemical fumes discussed above. This is why levels of CO2 which exceed 1000 ppm (or 1%) is associated with Sick Building Syndrome. Normal outdoor atmospheric levels are 400 ppm.
  • Furthermore, chemoreceptors in the human body located in the aorta, carotid arteries and in the brain respond to increased CO2 levels by INCREASING the breathing rate. This means that consequently more chemicals and dust enter the lungs and bloodstream.
  • Excess levels of CO2 can rapidly build up, particularly in an enclosed space such as a smaller room with the door shut and no air circulation. This can begin manifesting as physical symptoms as described in the illustration below.
Indoor Air Quality Symptoms Carbon Dioxide Toxicity

Symptoms of Carbon Dioxide Toxicity

TRUE STORY – I investigated a very new home (less than a year old) in which I was called out because the 23 year old healthy son passed out unconscious and non-responsive. When checked out at the hospital, they could find nothing wrong. When I arrived and began testing, I found something very wrong as my carbon dioxide meter began alarming immediately and climbed to very high levels even inside of an open hallway on the second floor. The family had been complaining of fatigue and headaches within a week of moving in.

The official medical terminology for carbon dioxide toxicity / poisoning is known as “hypercampnia”. Please note that this is an entirely different issue from CARBON MONOXIDE poisoning which is discussed in a blog post here:

Carbon Monoxide Safety Levels and Indoor Air Quality

Indoor Air Quality Testing: Oxygen Levels and Oxygen Deprivation Effects

One metric that is commonly overlooked in air quality studies is the oxygen percentage in the indoor environment with respect to normal atmospheric composition and how sensitive the human body is to this level. The oxygen levels on present day 21st Century Earth are nominally 20.9 % IF the relative humidity is 0%. (only found in extremely arid regions or dehumidified rooms such as an attic in summer) At one time in the distant past (the days of the dinosaurs) the oxygen levels on Earth were as high as 35 %.

The water vapor in the air displaces oxygen to some extent, so the more humid the air, the lower the % of oxygen. Here is a chart for reference:

Oxygen Level by Relative Humidity - Indoor Air Quality Factor

Oxygen Level by Relative Humidity

The body (particularly the brain) requires oxygen to function because it is a critical component in the cellular respiration process. (also known as the Krebs or Citric Acid Cycle) There are 42 steps in this cycle, and oxygen comes in at the last stage to combine with the H+ hydrogen proton gradient built up in the mitochondria (the “power plant” which is the main producer of ATP – also known as adenosine triphosphate which is the “energy currency” of biological organisms) of cells. Oxygen combined with hydrogen forms water which is the desired byproduct. Without it, the hydrogen atoms would drive the pH balance to a dangerously acidic level and denature proteins and kill all cellular functions.

Hypoxia – Oxygen Levels Deprivation Effects Toxicity Table

Notice that the safe range of oxygen is from 19.5 – 23.5 % which is only a 4 point percentage window. This illustrates how narrow the levels are between too much and too little oxygen. Too much oxygen (oxygen toxicity) can slow breathing levels to a rate that does not displace enough carbon dioxide (CO2) – a condition known as carbon dioxide narcosis. This typically only occurs when too much oxygen from a supplemental system such as tanks used in scuba diving or medical breathing equipment that is not adjusted correctly. This is virtually never an indoor air quality issue, but it is mentioned here to illustrate that even chemicals typically considered harmless or helpful can have dangerous effects at high enough levels.

So why would oxygen deprivation be an issue – aren’t oxygen levels homogeneous everywhere?

Not necessarily.

Areas with more forestation and foliage typically have higher levels of oxygen than outlying scrub prairies, but more to the point, deep urban environments often suffer from a shortage of oxygen for several reasons:

  • Lack of oxygen emitting plants and trees
  • High consumption of oxygen by dense populations such as found in heavily urbanized cites like Houston, Austin, the Dallas / Fort Worth region, etc. vehicles and other combustion motors
  • Oxidation / formation of chemicals that bind up oxygen molecules such as sulfur dioxides and nitrogen oxides
  • Displacement of oxygen by other gases and vapors such as water vapor, carbon dioxide, etc.

This is why particularly in downtown environments or near other heavily trafficked / polluted areas it is a good idea to know how much oxygen is being received as the chart above demonstrates that even a drop of 1 % or so (say 20.1% to 19.1%) can induce the subtle but deleterious effects of hypoxia.

To quote the early physician / alchemist Paracelsus: ” Poison is in everything, and no thing is without poison. The dosage makes it either a poison or a remedy.”

Diseases and Illnesses Related to Poor Indoor Air Quality

A number of diseases and illnesses can be traced to environmental factors related to poor indoor air quality.

Common allergies (which are medically referred to as Chronic Allergic Rhinitis) are caused by exposures to materials that have allergenic / antigenic properties. If an individual becomes sensitized, then inhalation or mucous membrane / skin contact exposures may result in inflammatory responses in the nose, throat, sinuses, eyes and upper airways. Typical symptoms are increased mucus / phlegm production, runny eyes and nose, as well as sneezing and coughing as the body attempts to expectorate these irritants.

Allergies related to inhaled substances are generally caused by immunological sensitization to dust mite antigens, mold spores, hyphal fragments, (which are bits of fungal biological material) pet danders and plant pollen. Certain antigens produced by insects such as cockroaches, birds, rats, mice and other rodents may also trigger histamine reactions.

These symptoms arise as a part of the bodily defense against foreign materials which can provoke inflammation by immunological sensitization and cumulative exposures through up to four different mechanisms – the most prominent of which is the production of IgE antibodies in response to exposures to an antigenic substance which can cause a detectable immune reaction. Antigens that provoke an IgE response are characterized as allergens.

Antigens and allergens are relatively large molecules and typically proteins. However, there are certain highly reactive compounds such as formaldehyde, (HCHO)  toluene diisocyanate (TDI) and trimellitic anhydride (TMA) which can complex with proteins to produce hapten antigens which in turn induce allergic responses.

Allergy Reaction Chain IgE Antigens from Allergens found in Indoor Air

Allergy Reaction Chain IgE Antigens

These factors can be synergistically amplified if the indoor air also has poor ventilation and a lack of fresh air exchange.

A little known fact is that elevated carbon dioxide levels from tightly built buildings and homes INCREASES respiration rate, and therefore the intake of allergens and other bioaerosols that cause respiratory irritation and inflammation.