Tag Archives: indoor air quality

Dallas Indoor Air Quality Testing 214.912.4691 – Dallas Green Building Clearance Testing 804.2, Dust & Particulate Matter, Bacterial / Mold Inspection and SARS-CoV-2 Air Testing

DAYS / HOURS OF OPERATION  (text to with inquiries – 24 / 7 but please include physical address, square footage and email)

214.912.4691

7 Days a Week Mon – Fri: 8 AM – 8 PM                   Weekends: Noon – 6 PM

COMMERCIAL / INDUSTRIAL CLIENTS ONLY –  HOMEOWNERS & RESIDENTIAL CLIENTS CLICK HERE

City of Dallas Green Building Clearance Post Construction IAQ (Indoor Air Quality) Testing  (804.2)

Dallas Green Building Post-Construction IAQ Clearance Testing for 804.2 Certificate of Occupancy

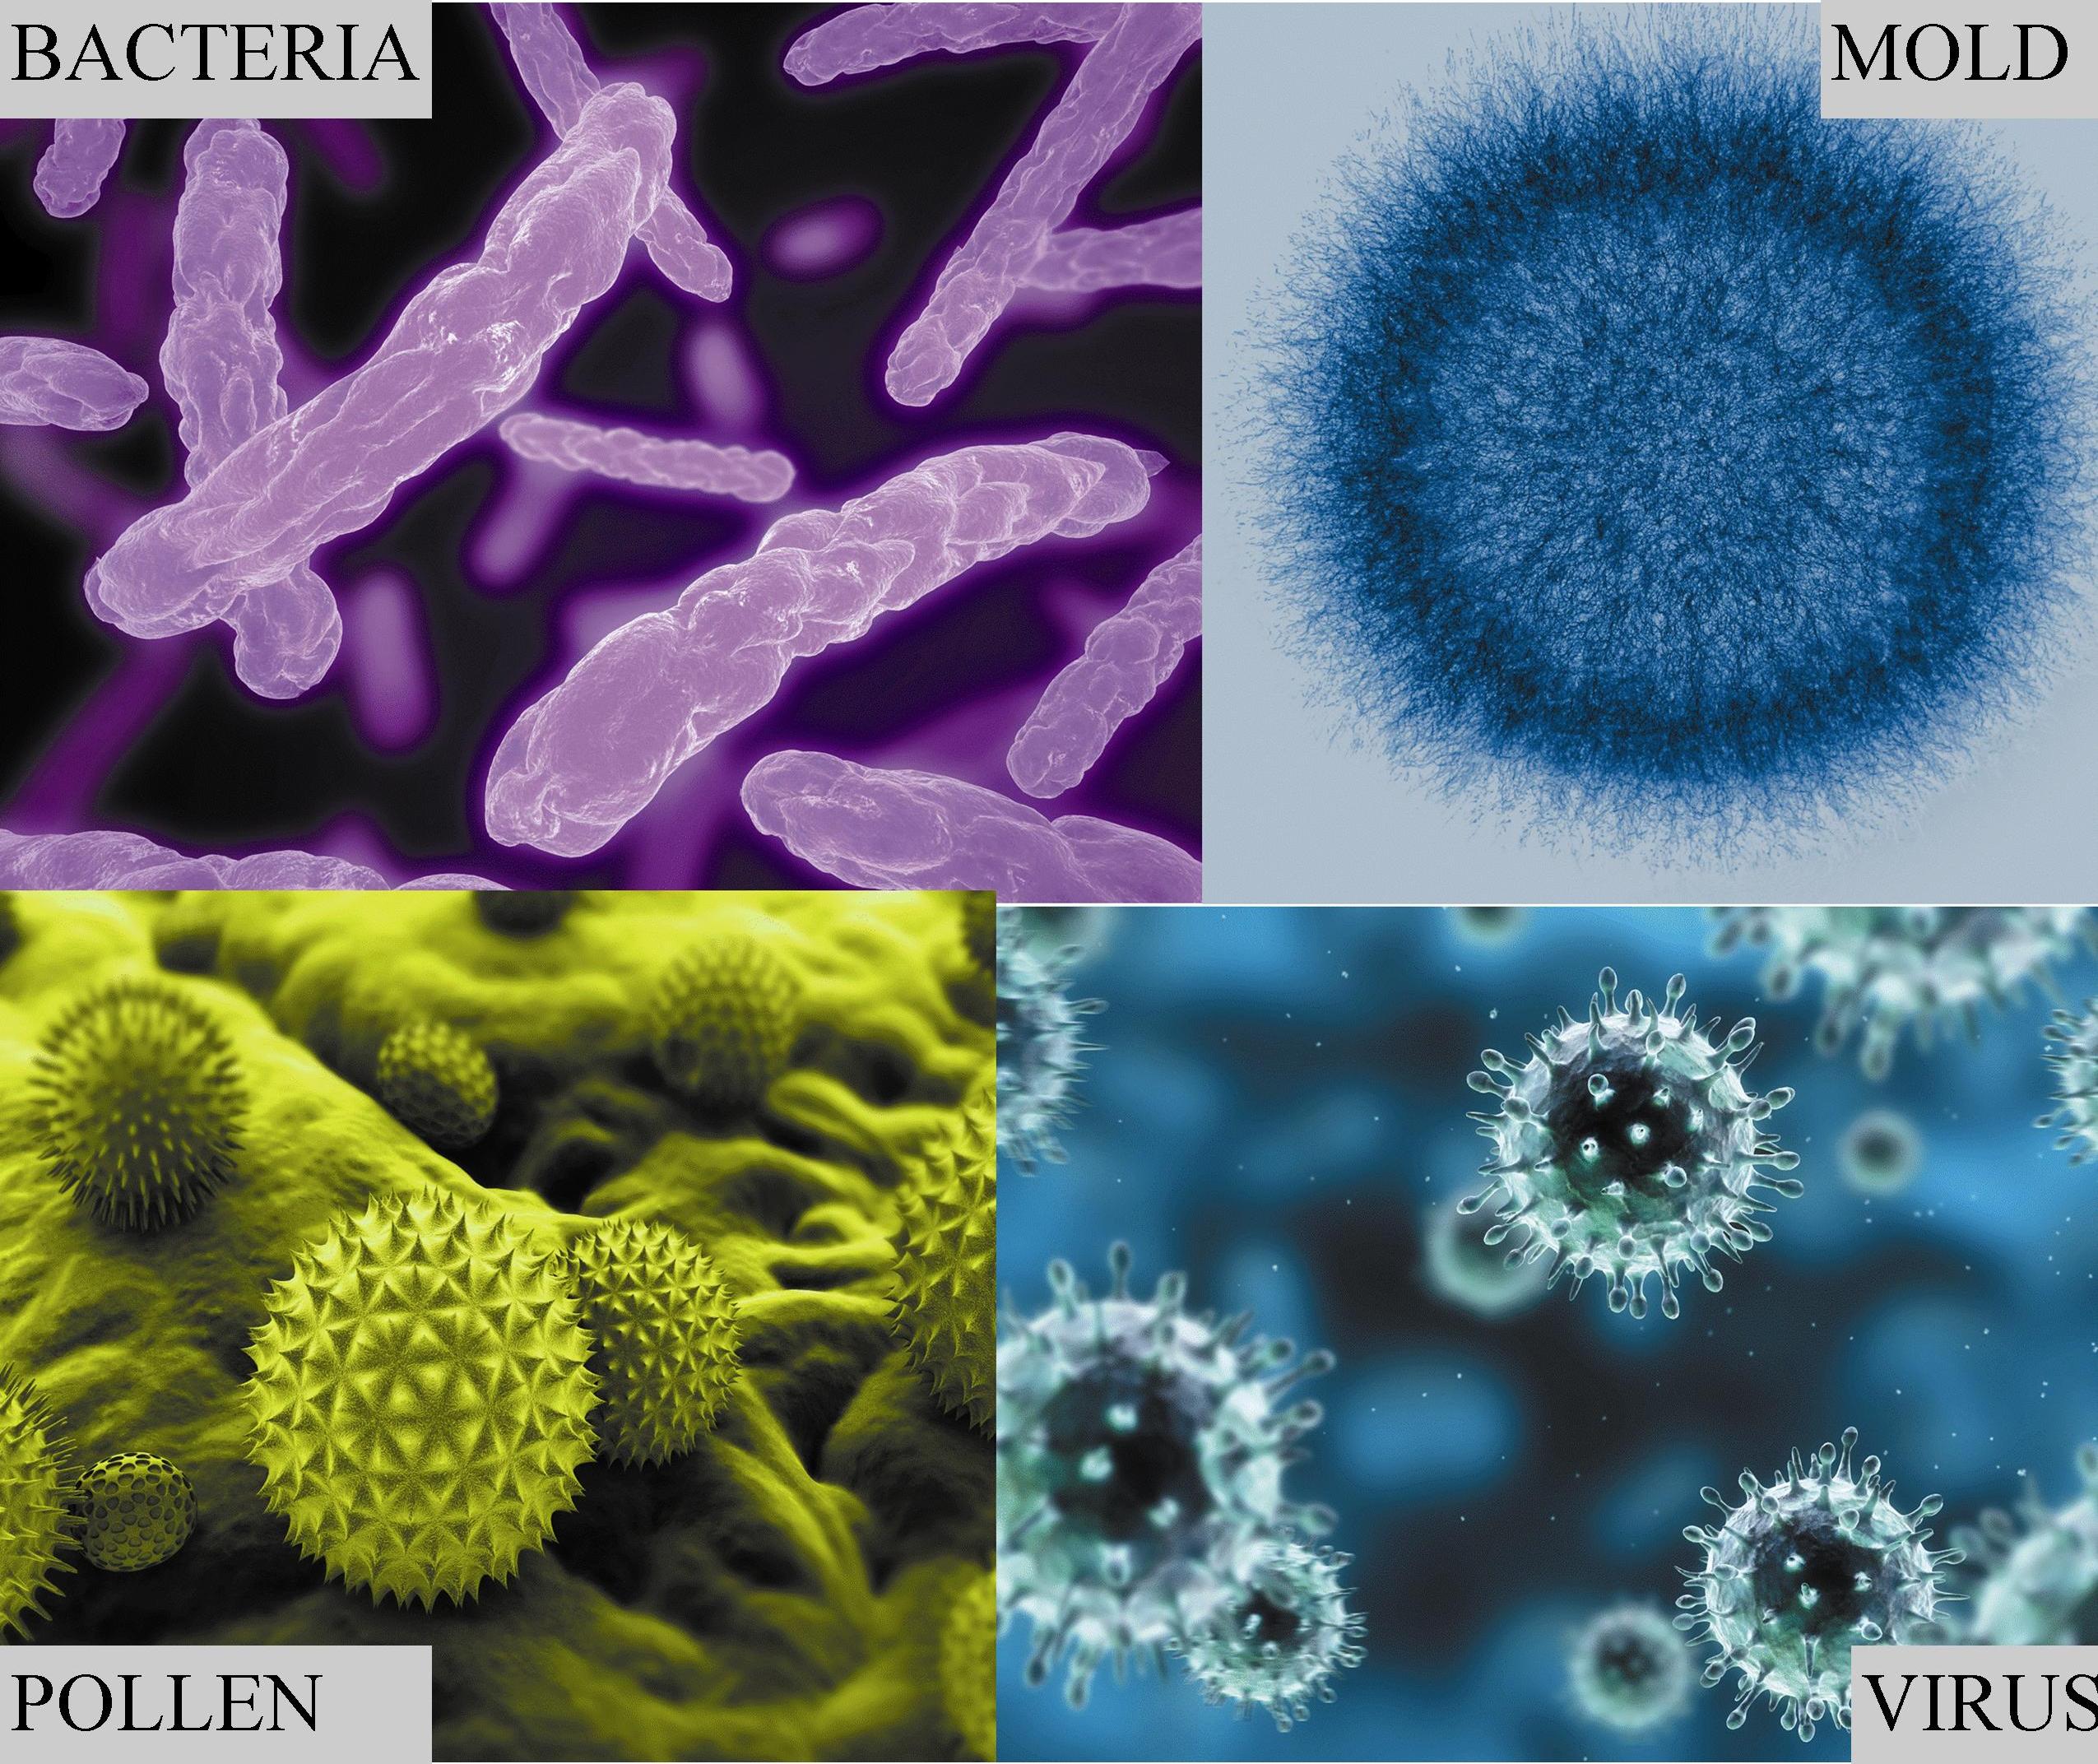
Biomedical / Environmental Health & Safety Consulting & Field Testing With Industrial Hygiene & Microbiology expertise including Bacterial Contamination Testing

Novel Coronavirus SARS-CoV-2 / CoViD-19 Commercial / Industrial BioSafety Air & Surface Swab Testing & Consulting for Pandemic Response & Best Hygiene Practices

Based on our expertise in microbiology, disinfectant chemistry, respirators, indoor air quality testing as well as Industrial Safety, Health & Hygiene work.

Indoor Air Quality Dallas Houston Austin

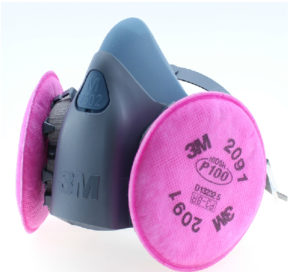
P100 Respirator with 2091 Filters by 3M

214.912.4691 – Through years of performing environmental testing in the Dallas / Fort Worth – DFW Metroplex area, ScanTech has evaluated numerous risk factors that impact human health from the perspectives of both short term (acute effects) and long term (chronic health issues) impacts in the occupational health realm.

* ScanTech only performs IAQ inspections for COMMERCIAL / INDUSTRIAL CLIENTS

ScanTech can check for the following key indoor air quality level indicators (many with time-based datalogging available) and have a report for you at the time of the onsite visit:

  • Formaldehyde (HCHO)
  • VOCs (Volatile Organic Compounds)
  • Carbon Dioxide (CO2) – measurement of fresh air dilution that tracks with VOCs
  • Carbon Monoxide (CO) – a dangerous from combustion byproducts
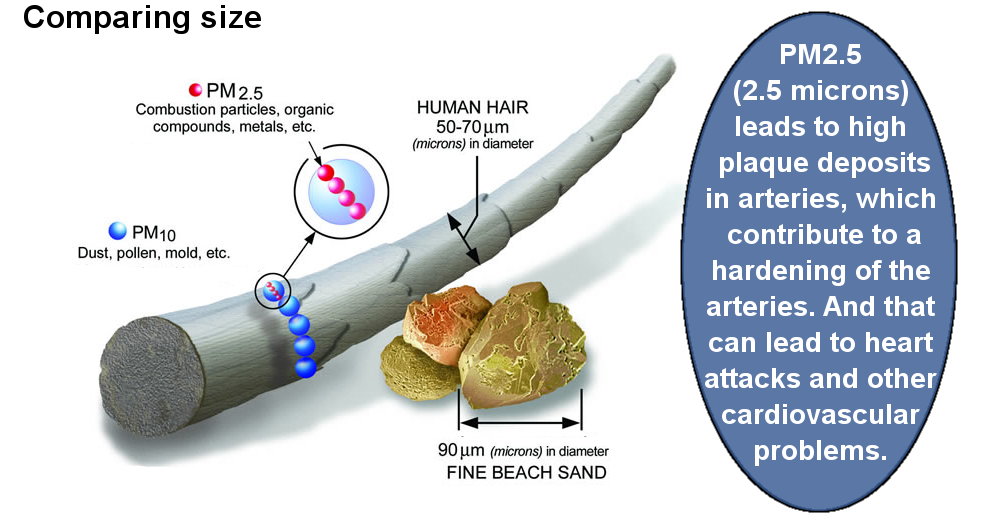
  • Respirable Dust Particles in PM2.5 (fine) and PM10 (coarse) size regimes
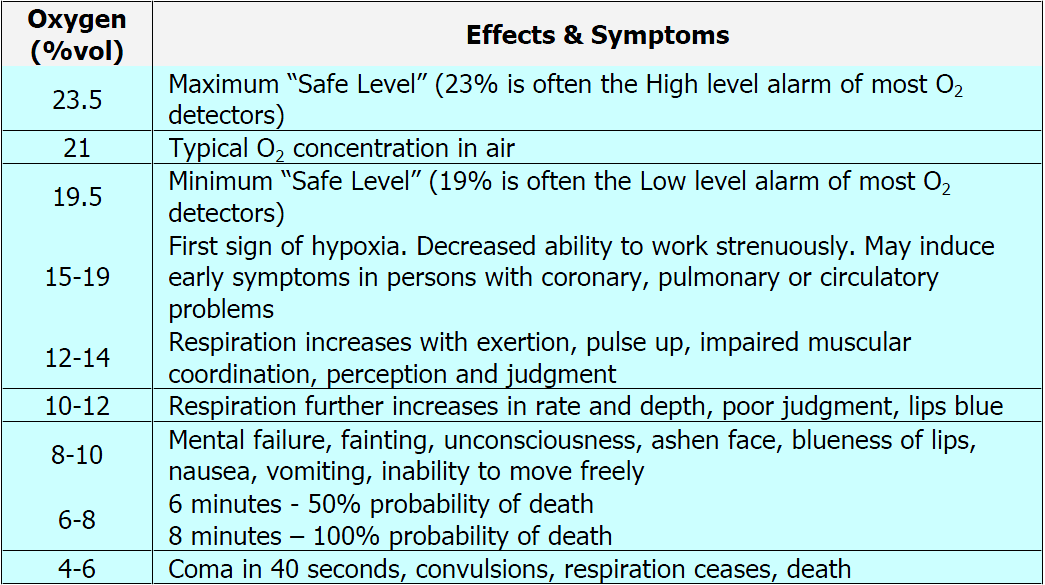
  • Oxygen Levels
  • HEPA Filtration and other central air purifier efficiency (MERV Rating)
  • Pressure differentials between inside and outside (affects contamination potential)
  • Relative ventilation levels – critical to know in newer buildings that are tightly built

Specialized Optional Air Testing

  • City of Dallas Green Building Post Construction IAQ Clearance Testing 804.2  https://emfsurvey.com/dallas-green-iaq-clearance-testing-post-construction-804-2-certificate-of-occupancy/
  • Surface Swab & Air Testing for Novel Coronavirus SARS-CoV-2 which causes CoViD-19
  • Mold Testing & Inspection including air samples, tape lifts and visual inspection
  • Bacterial ATP, Microorganism, Parasite & Bio-Film issues including Legionella
  • Radon Rn-222 Levels (alpha emitter lung carcinogen found in Texas including Dallas)
  • Ozone levels testing – ozone is a oxidizing respiratory irritant
  • Hydrogen Sulfide (H2S) – toxic sewer gas that has a foul odor

along with atmospheric factors such as:

  • Temperature
  • Relative Humidity
  • Absolute Humidity
  • Mixing Ratio, Vapor Pressure, Dew Point
  • Barometric Pressure (to judge whether the structure is under positive or negative pressure with respect to the outside air)
National Ambient Outdoor Air Quality Standards

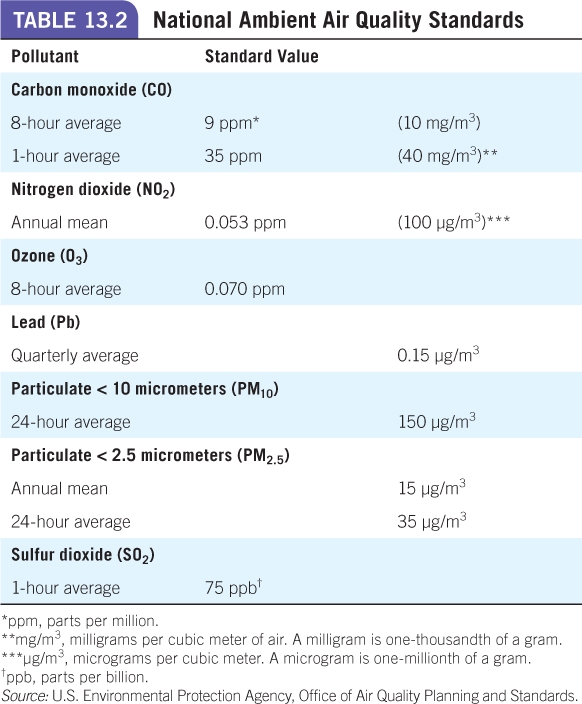
National Ambient Outdoor Air Quality Standards set by the EPA (Environmental Protection Agency)

Many residents of the Dallas / Fort Worth area suffer from the following symptoms, ailments, and diseases – much of which can be traced either directly to air quality and composition or is exacerbated by poor air quality:

  • Allergies & Sinus Infections – (high particulate counts and VOCs, formaldehyde)
  • Chronic Allergic Rhinitis – (bio-aerosols)
  • Eye irritation – (formaldehyde, hydrogen sulfide, VOCs)
  • Congestion – (high particulate counts and VOCs, formaldehyde)
  • Inflammation – (formaldehyde, VOCs)
  • Fatigue – (carbon monoxide, carbon dioxide)
  • Insomnia
  • Headaches – (carbon monoxide)
  • Dizziness – (carbon monoxide)
  • Cognitive issues including difficulty focusing
  • Nausea
  • Coughing – (high particulate counts, mold, MVOCs)
  • Asthma & other breathing difficulties – (MVOCs, high particulate counts, ozone)
  • Bronchitis – (irritation of the lung bronchi)

These issues can contribute to and/or be symptomatic of more serious ailments such as:

  • COPD (Chronic Obstructive Pulmonary Disease)
  • Hypersensitivity Pneumonitis
  • Carbon Monoxide / Carbon Dioxide Poisoning
  • Autoimmune Disease
  • Cardiovascular Disease
  • Stroke
  • Lung Cancer
  • Leukemia
  • Non-Hodgkin’s Lymphoma
  • Neurological issues due to chemical exposure and/or oxygen deprivation

In many cases, a simple series of air quality tests that detect and report important metrics such as respirable particle levels, VOCs, formaldehyde levels, radon gas, carbon monoxide, carbon dioxide, oxygen levels, etc. can narrow down the issue(s) responsible. Very often, mitigation is relatively inexpensive and well worth the modest investment.

While ScanTech can make suggestions on how to clean up your air, we are not an equipment vendor or installer, so there is no conflict of interest in selling you products that you don’t need. (or that may make things worse)

ScanTech Residential Service Map Dallas Fort Worth DFW

  • Nanotoxicology testing for evaluating the safety of nanomaterials which being incorporated in many modern manufactured products. We will collect and send samples to labs that are able to analyze important characteristics such as particle size, charge, solubility, geometry, aspect ratio, etc. in order to determine potential biological impact. The environmental effect of many nanoparticles are largely unknown and currently subjects of scientific research.

Cities for commercial indoor air quality (IAQ) inspection services include: Dallas, Fort Worth, Houston, Austin, San Antonio, Plano, Highland Park, University Park, Park Cities, Arlington, Grapevine, Frisco, Denton, McKinney, Allen, Lewisville, Irving, Mesquite, Bedford, Euless, Richardson, Coppell, Grand Prairie, Garland, Addison, Farmers Branch, Rockwall, Carrollton, Parker, Rowlett, Lucas, Fairview, Park Cities, Keller, Roanoke, The Colony, Highland Village, Lake Dallas, Corinth, Prosper, Duncanville, Lancaster, Rowlett, Royse City, Trophy Club, Southlake and Hurst. Counties served include Dallas, Collin, Denton, Tarrant and Rockwall County.

Biological Contaminants in Indoor Air Quality: Allergens, Bacteria, Mites, Viruses

Bioaerosol Organic Dust from Mold Bacteria Pollen in Indoor Air Quality

Organic Dust in Indoor Air Quality

There is growing evidence that a large proportion of environmentally related or contributed illness is correlated with particulate phase (solid) and (to a lesser extent) gas phase exposures to contaminants produced by biological organisms such as mold, bacteria, dust mites, etc. And it is not just live organisms which are at issue, but even the RESIDUAL BIOLOGICAL MATERIAL of dead or non-viable fungus, molds, viruses, bacterial species and pets which can trigger symptoms and contribute or cause certain diseases.

VOCs Particulates Dust Bioaerosols Chart Indoor Air Quality

Indoor Air Quality Contaminant Composition by %  – VOCs Particulates Bioaerosols Chart

These contaminants from both live and dead biological organisms include antigens, endotoxins, glucans, mycotoxins, microbial volatile organic compounds, (MVOCs) and immunologically active particles produced by insects, arachnids, (mites / spiders) and common pets such as cats and dogs.

These contaminants are known as “bioaerosols” or “organic dust” and vary in size from less than 1 micron to over 100 microns in diameter. Note that the smaller the particle, the more likely it is to remain suspended in the air (for days or longer) and penetrate the epithelial cells of the respiratory tract to enter the bloodstream directly.

Bioaerosol Size Ranges in Indoor Air Quality

Bioaerosol Size Ranges in Indoor Air Quality Organic Particles & Contaminants

Live species of microbiological origin may cause infectious disease by airborne transmission which again stresses the importance of indoor air quality. With a heavy enough load, infection through contact and / or ingestion of heavily contaminated surfaces (not necessarily inhaled) could result. Exposures to mold spores / fragments and allergens produced by insects, pet danders may cause immunological reactions such as chronic allergic rhinitis and asthma which has a high prevalence rate in developed countries and resembles symptoms of gas phase irritants. Exposures to HIGH concentrations of small fungal spores and the spores of higher bacteria may cause hypersensitivity pneumonitis.

Exposures to fungal glycans, bacterial endotoxins (such as found in Gram negative bacteria) or MVOCs may also cause inflammatory responses in the respiratory system. Mycotoxin exposure may directly poison the human organ systems.

Bacteria: Different Size Shape Arrangement of Bacterial Cells

Bacteria: Different Size Shape Arrangement of Bacterial Cells

Different Size, Shape and Arrangement of Bacterial Cells


Indoor Air Quality Testing of Fine (PM2.5) and UltraFine Particles – Why Smaller Particles = Unsafe and Hazardous

It isn’t necessarily the dust you can see that can cause the most severe health issues, it is microscopic dust that is smaller than the eye can resolve that is now linked to a number of ailments of not just the respiratory tract, but also cardiovascular disease.

Why is this?

Because larger particles such as PM10 or 10 micron particles which fall into the COARSE size range dust particles (2.5 microns – 10 microns) as defined by the EPA:

  • Fall to the ground much faster (within minutes) instead of staying airborne for days or longer where they can be inhaled such as is typical of smaller particles. This also means that smaller particles can travel much further from the source. (such as combustion products from a road or highway)
  • The bodily defense mechanisms of mucus and cilia which are designed to trap larger particles and move them up and out of the lungs do not defend as well against smaller particles as they can bypass these systems and make their way progressively further down into the respiratory system.

However, the smaller PM2.5 particles which fall into the FINE size range (0.5 – 2.5 microns) are:

  • Sufficiently small particles of a few microns or less in diameter which can actually bypass the para-cellular (between the cells) junctions of the epithelial cells in the lung air sacs, which means they can go deep enough into the human respiratory system to pass DIRECTLY into the bloodstream.
  • Prone to stay suspended for much longer periods of time (hours, days, weeks) and can travel a longer distance from the original source.
  • Not easily filtered out by the body’s natural defenses due to their small size.
  • And if these particles are of a chemical nature, (such as aggregated / adsorbed VOCs, heavy metals, etc.)  then toxic damage can occur. If they are of a more inert nature, they can still cause damage by nucleating deposits in arteries.

For an idea of how small these particles are in relation to familiar objects such as hair and sand, here is an illustration.

PM2.5 Particle Scale from Mold Dust Pollen and Indoor Air Quality IAQ

PM2.5 Particle Scale and Effects Indoor Air Quality – microns are abbreviated as um or micrometers

Some of the worst air quality readings I get are inside of expensive homes that look immaculate, (because the larger, visible dust particles have been cleaned up) but still do not adequately filter out the more dangerous smaller suspended respirable particles. (SRP)

UltraFine particles (UFP) are in the nanoscale range of 100 nanometers or less (0.1 microns) just below the PM2.5 FINE particle size range and they can penetrate though the membranes of cells and migrate to distant organs such as the brain. An example is Diesel Particulate Matter (DPM) which are essentially soot (carbon) but with carcinogens such as benzopyrenes adsorbed onto the particle which makes it a potential physio-chemical toxin. Benzopyrenes are considered harmful because they can intercalate (insert themselves) in between the nitrogeneous bases of DNA and thereby interfere with self-replication and protein production by transcription errors.

VOCs Indoor Air Quality Harmful Toxic Airborne Chemical - Structural Diagram

Chemical Structural Diagram of Benzo(e)pyrene (a VOC)

Ambient Air Pollution and Risk for Ischemic Stroke and Transient Ischemic Attack (TIA)

Indoor Air Quality Testing: Oxygen Levels and Oxygen Deprivation Effects

One metric that is commonly overlooked in air quality studies is the oxygen percentage in the indoor environment with respect to normal atmospheric composition and how sensitive the human body is to this level. The oxygen levels on present day 21st Century Earth are nominally 20.9 % IF the relative humidity is 0%. (only found in extremely arid regions or dehumidified rooms such as an attic in summer) At one time in the distant past (the days of the dinosaurs) the oxygen levels on Earth were as high as 35 %.

The water vapor in the air displaces oxygen to some extent, so the more humid the air, the lower the % of oxygen. Here is a chart for reference:

Oxygen Level by Relative Humidity - Indoor Air Quality Factor

Oxygen Level by Relative Humidity

The body (particularly the brain) requires oxygen to function because it is a critical component in the cellular respiration process. (also known as the Krebs or Citric Acid Cycle) There are 42 steps in this cycle, and oxygen comes in at the last stage to combine with the H+ hydrogen proton gradient built up in the mitochondria (the “power plant” which is the main producer of ATP – also known as adenosine triphosphate which is the “energy currency” of biological organisms) of cells. Oxygen combined with hydrogen forms water which is the desired byproduct. Without it, the hydrogen atoms would drive the pH balance to a dangerously acidic level and denature proteins and kill all cellular functions.

Hypoxia – Oxygen Levels Deprivation Effects Toxicity Table

Notice that the safe range of oxygen is from 19.5 – 23.5 % which is only a 4 point percentage window. This illustrates how narrow the levels are between too much and too little oxygen. Too much oxygen (oxygen toxicity) can slow breathing levels to a rate that does not displace enough carbon dioxide (CO2) – a condition known as carbon dioxide narcosis. This typically only occurs when too much oxygen from a supplemental system such as tanks used in scuba diving or medical breathing equipment that is not adjusted correctly. This is virtually never an indoor air quality issue, but it is mentioned here to illustrate that even chemicals typically considered harmless or helpful can have dangerous effects at high enough levels.

So why would oxygen deprivation be an issue – aren’t oxygen levels homogeneous everywhere?

Not necessarily.

Areas with more forestation and foliage typically have higher levels of oxygen than outlying scrub prairies, but more to the point, deep urban environments often suffer from a shortage of oxygen for several reasons:

  • Lack of oxygen emitting plants and trees
  • High consumption of oxygen by dense populations such as found in heavily urbanized cites like Houston, Austin, the Dallas / Fort Worth region, etc. vehicles and other combustion motors
  • Oxidation / formation of chemicals that bind up oxygen molecules such as sulfur dioxides and nitrogen oxides
  • Displacement of oxygen by other gases and vapors such as water vapor, carbon dioxide, etc.

This is why particularly in downtown environments or near other heavily trafficked / polluted areas it is a good idea to know how much oxygen is being received as the chart above demonstrates that even a drop of 1 % or so (say 20.1% to 19.1%) can induce the subtle but deleterious effects of hypoxia.

To quote the early physician / alchemist Paracelsus: ” Poison is in everything, and no thing is without poison. The dosage makes it either a poison or a remedy.”